still lovin’ the svg
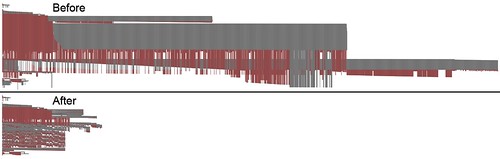
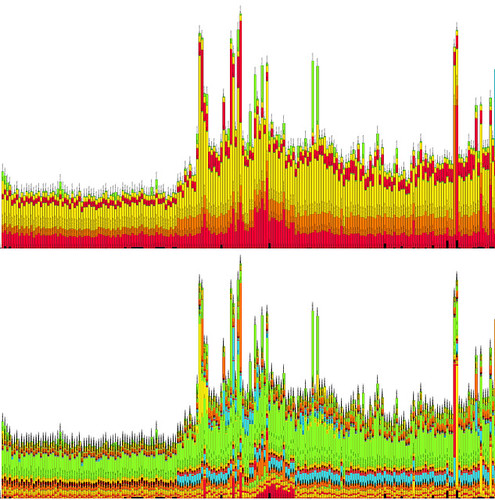
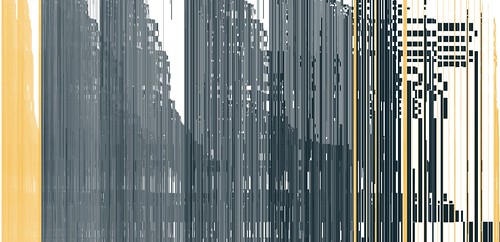
i posted a few months back on using the scalable vector graphics (SVG) web format for visualizing data structures. i keep finding more great uses for it! by now i've also put it to work visualizing GPU memory allocations, asynchronous file operations and access patterns, hierarchical per render frame CPU work, and location based data map overlays. this is quite the handy visualization tool to have around! :)
in addition to lines which i covered in the first post, i've now been using circles, rectangles, text, images, and layers. these are all super easy just like the lines. for example:
i've found it really handy to go into InkScape and make a quick SVG by hand then load it up in a text editor to see the right markup to use for different things. for example with layers InkScape has it's own namespace and extra options so you can put really spammy data in topmost hidden layers and only reveal them when you're zoomed in on some area of interest.
here's a link to the full W3C SVG standard which is a great reference for all the possibilities. and here are some new examples of this madness in action.