years ago, my iMac was running craaaaaazy slow. it was pretty much unusable and seemed like anything that touched the disk took minutes instead of milliseconds. initially i thought it was from a macOS update (like maybe they didn’t bother testing on spinning disks anymore and just let things become unusable on old systems) but eventually realized it must be a problem with the hard disk drive.
all the disks i’ve had die in the past would make crazy noises leading up to an eventual complete failure. so this drive is quite strange with its S.M.A.R.T. data being fine and reading and writing working properly, but it just does everything 100X slower than it should. 🤔
at any rate, i realized i needed to replace the drive but the iMac is quite literally glued together! so i wound up just taping an SSD to the back and plugging it in with a USB adapter and considering that good enough. 😆

now i finally worked up the courage cut it open and do a proper drive replacement. it was scary but worked out pretty well! i got this OWC servicing kit from Amazon with all the tools to cut through and replace the glue.
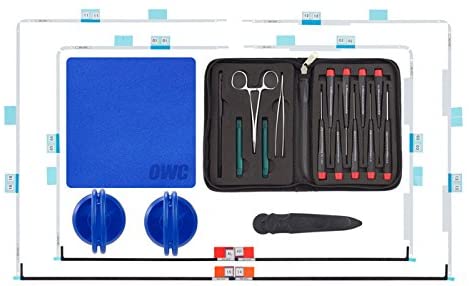
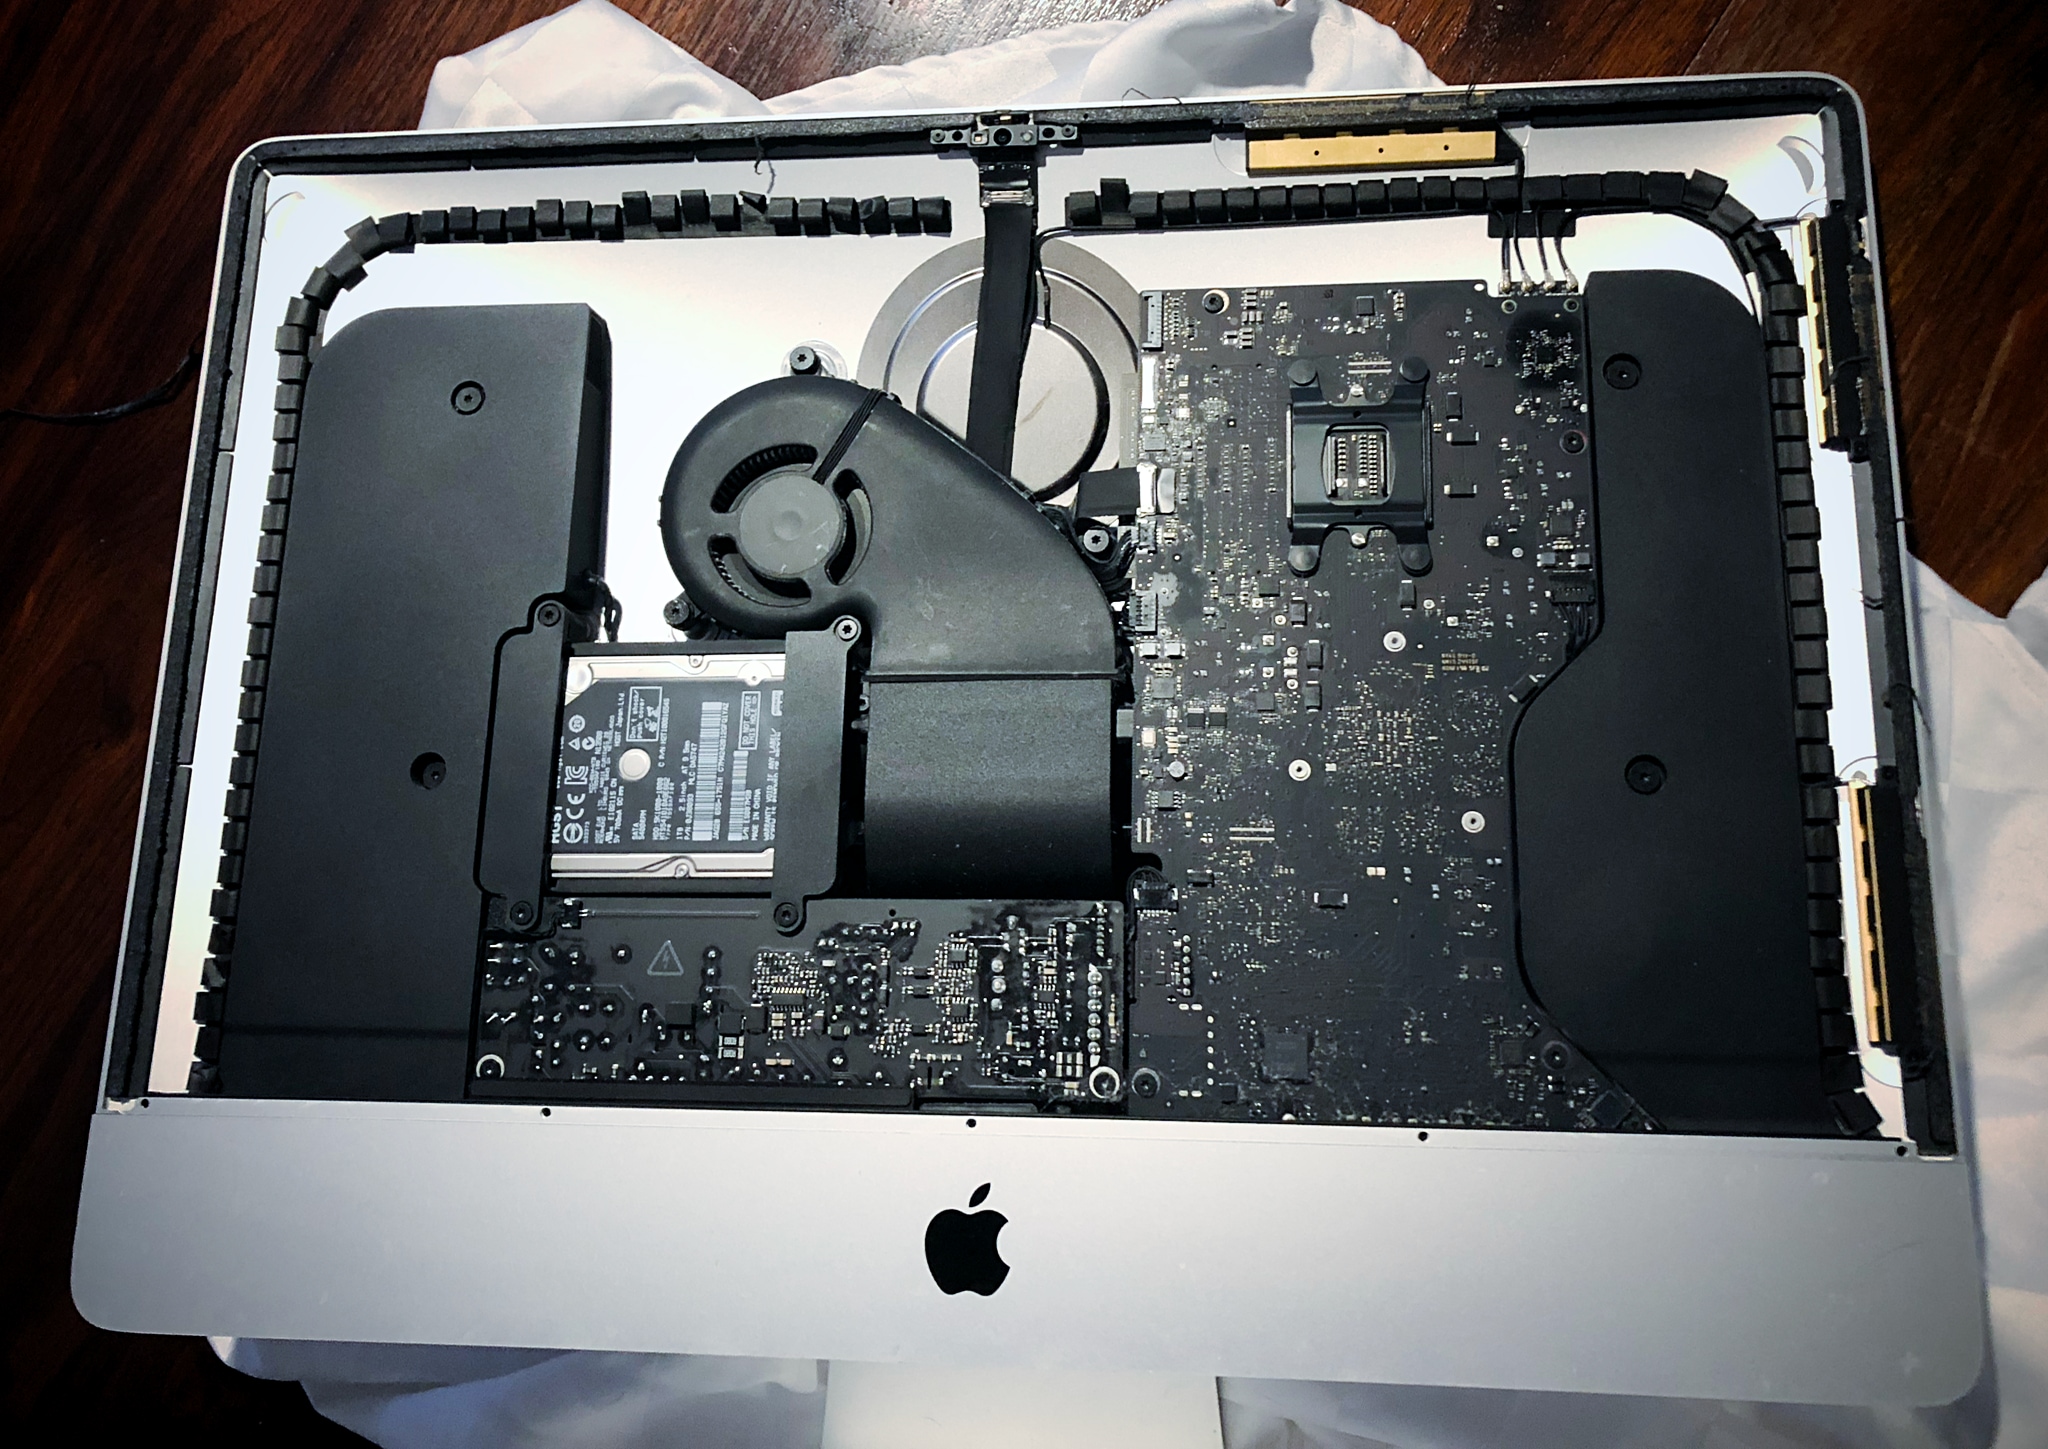
you smack the suction cups on the corners of the display and then use the little plastic pizza cutters to press into the sides under the display and cut all the glue that holds it in place. this part was super scary and didn’t work quite like the instructions. i had to press much farther in to loosen and cut the glue and pull up on the display while doing it. it had me very worried about cracking the super thin display and making the whole computer worthless. once the display was off though it was simple to remove the hard disk and toss in the SSD.
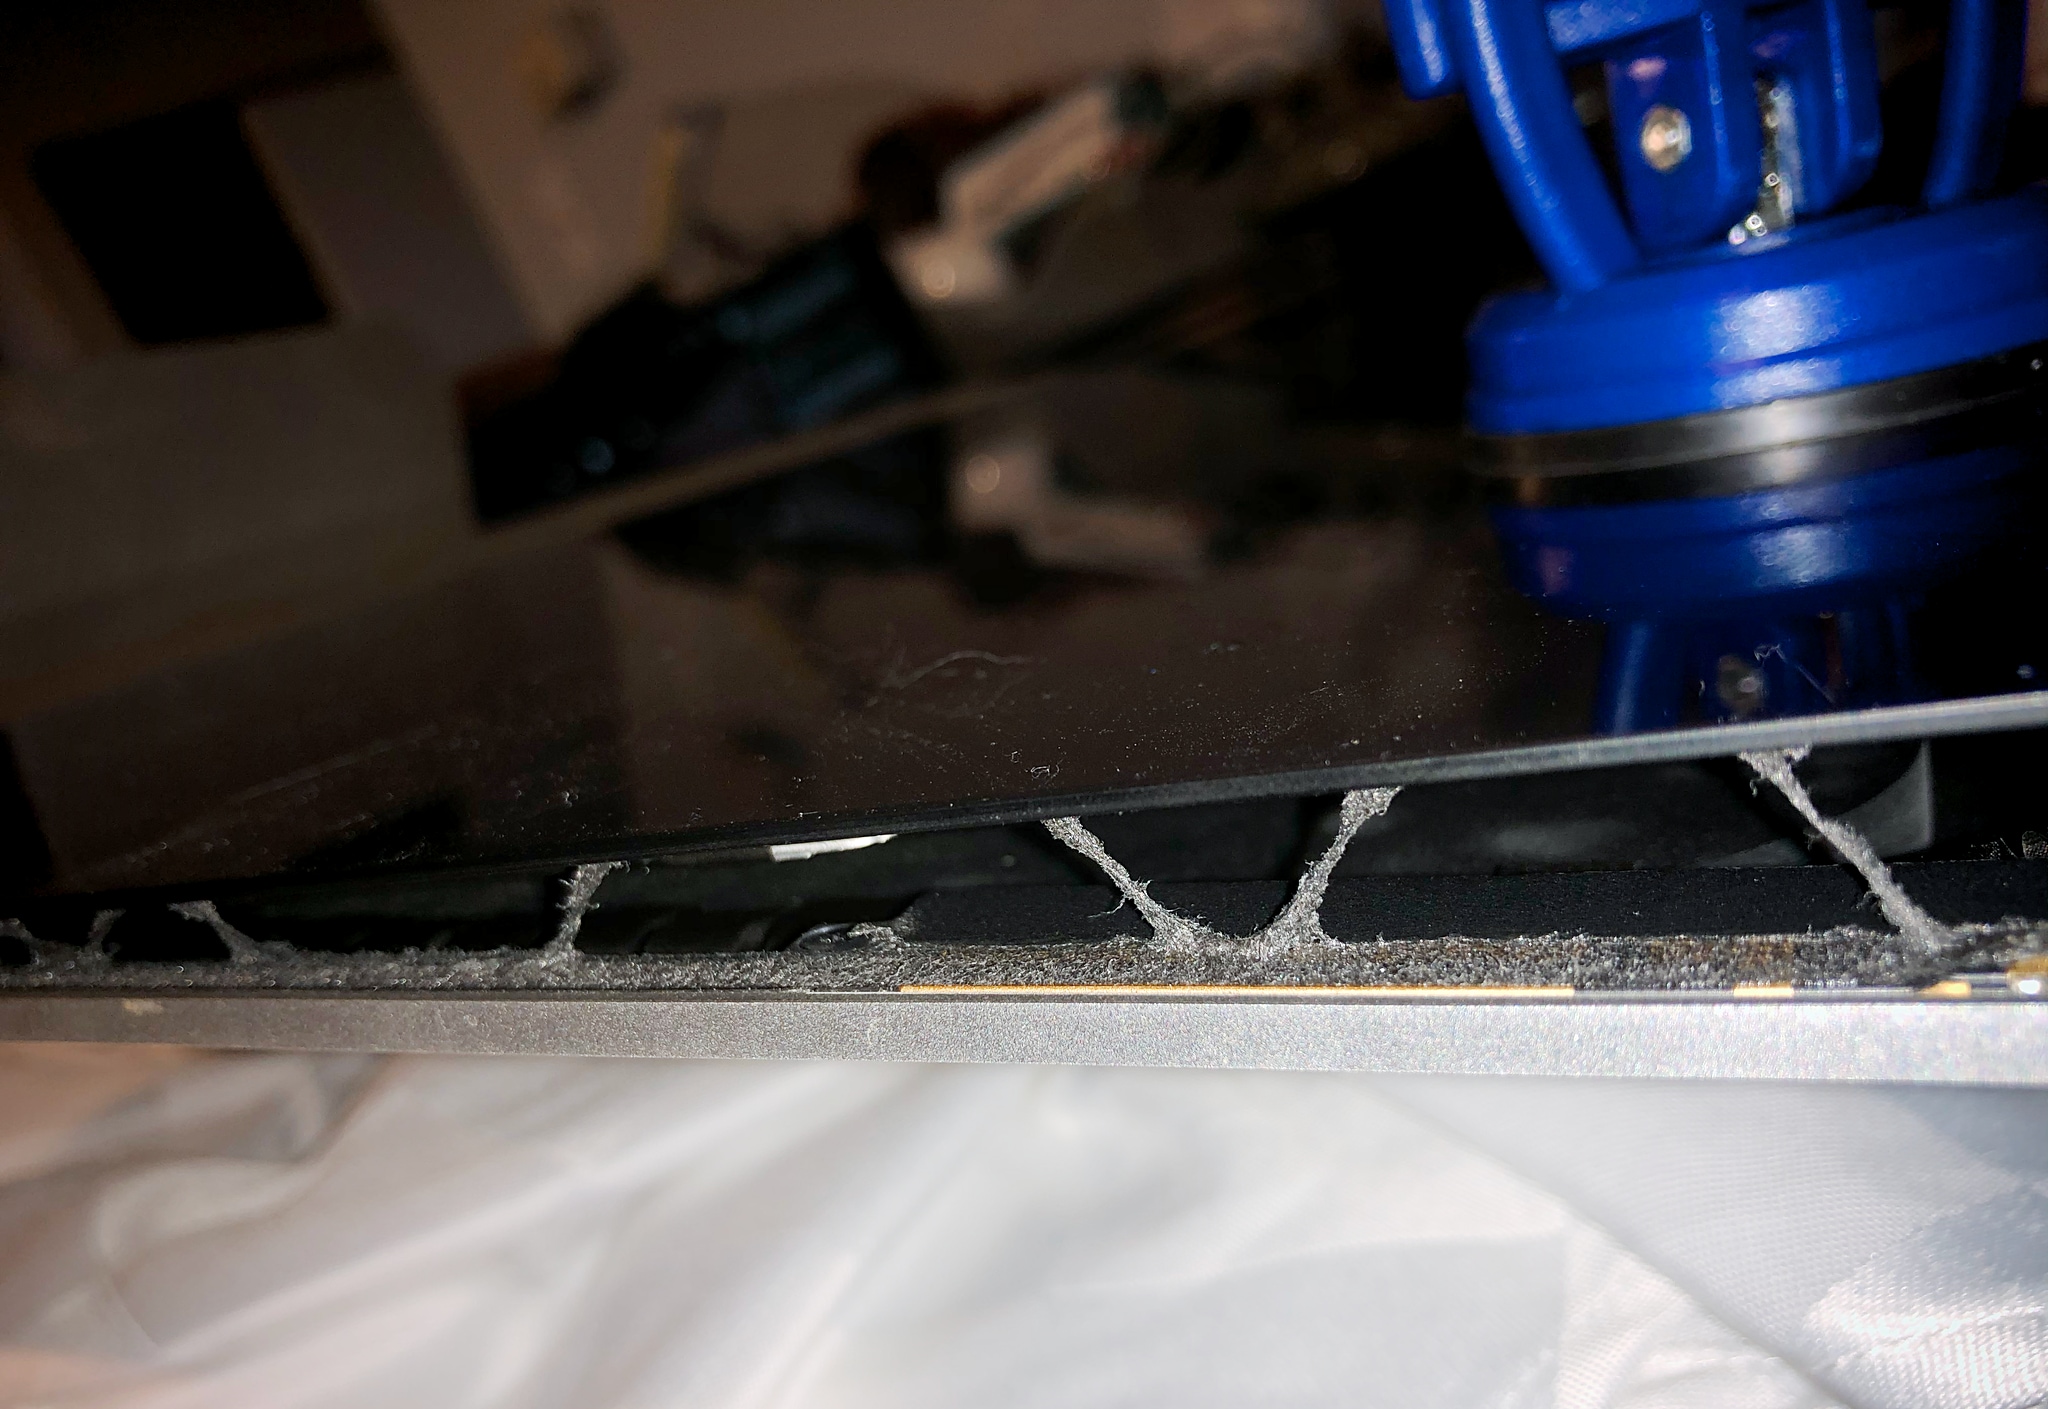
the final step was putting glue strips back on and then very carefully lowering the display into place while connecting the tiny ribbon for it. this was challenging and in the end i was ever so slightly off so my display sticks out a bit on the right. you can’t really notice it with your eyes but running a finger along the edge you can feel it.
it seemed all was good until the next morning i walked into my office and saw… the display had fallen right off!!! 😱 thank god my cluttered desk had a speaker and some pens that stopped it from smacking down on the desk or even the floor!
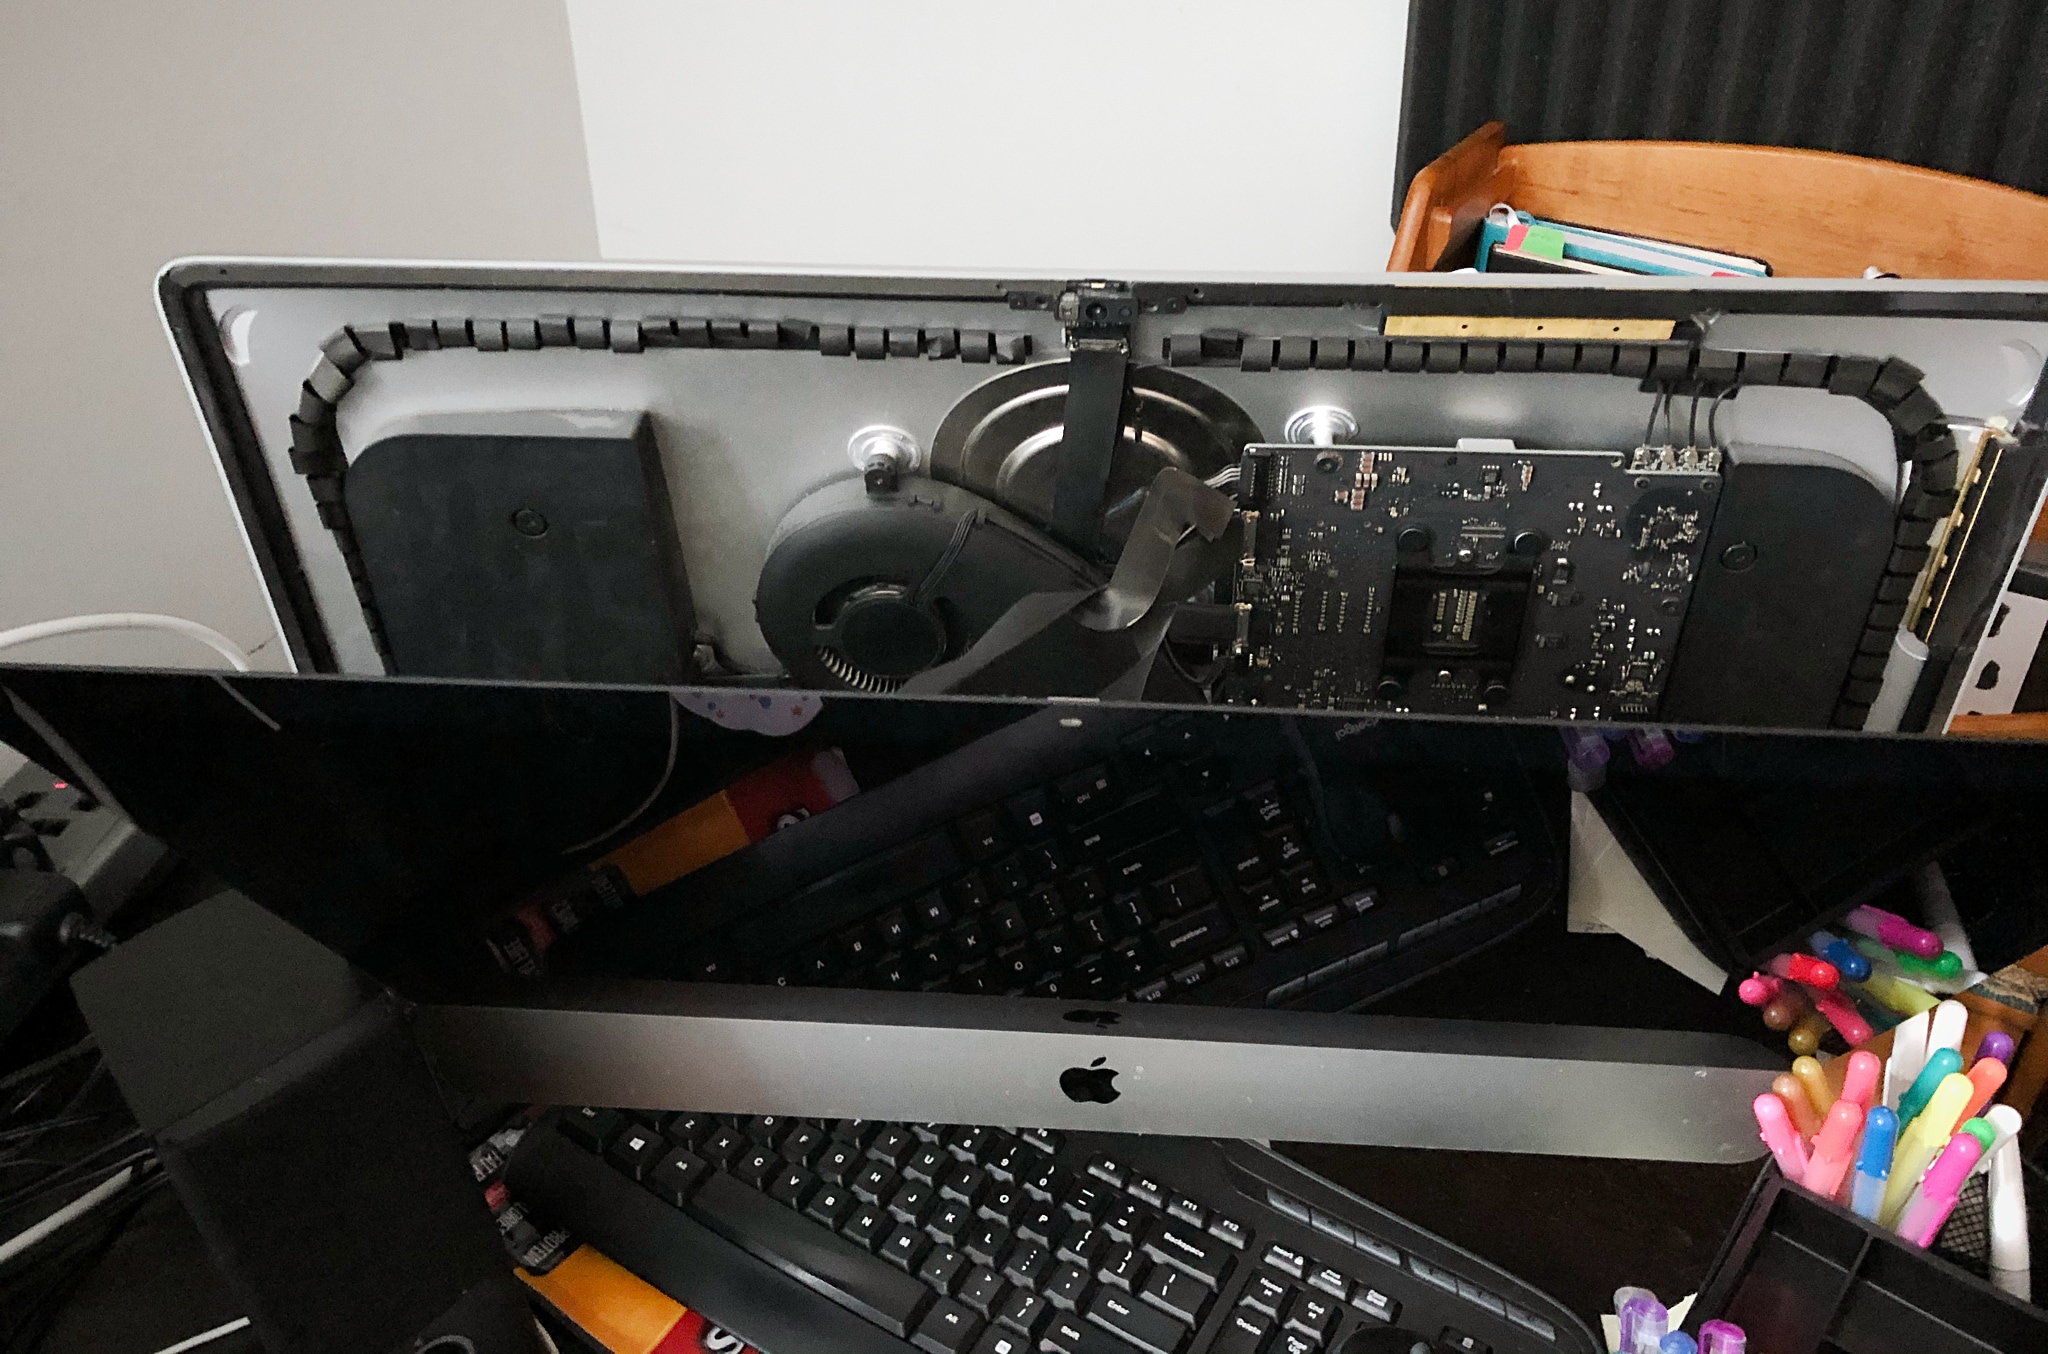
fortunately the glue was still sticky so i pressed it back into place and this time leaned the iMac backwards and things seem to be OK since.